Zabbix 8.0 LTS shipped on November 5, 2026, with native OpenTelemetry, a ClickHouse history backend and event correlation. That means several of the usual reasons for leaving Zabbix now have a built-in fix. This guide covers when switching still makes sense and which of the 10 best Zabbix alternatives fits your setup. Every price, free tier, rating and project-health figure below was checked in November 2026, with pricing confirmed on November 19, 2026.
Key takeaways
- Test Zabbix 8.0 LTS before you migrate. It now handles traces, alert noise and database scaling.
- Zabbix 7.0 LTS full support ends June 30, 2027, so plan your upgrade or switch before then.
- Checkmk Community (formerly Raw) is the closest free replacement, and it’s easier to run.
- LibreNMS is the best choice for SNMP switches and routers. Prometheus + Grafana suits Kubernetes.
- Free tiers have catches: PRTG’s 100 sensors cover only about 10 devices, and Datadog no longer offers a free plan.
Fact-checked
We checked these key facts against the sources named, on November 19, 2026:
- Beyond the free 100 GB, the original data option costs $0.40 per GB (source: newrelic.com)
- PRTG 500 costs $200 a month billed annually, and the tiers run up to PRTG 10000 at $1,642 a month (source: cubeapm.com)
- OpManager has the most Gartner Peer Insights reviews of any tool here (4.5 from about 1,022 ratings) (source: gartner.com)
- Each CPU, disk, port or service check uses one sensor, so the free 100 sensors cover only about 10 devices (source: costbench.com)
- Capterra and Software Advice list Standard from about $95 a year for 10 devices and Professional at about $145 (source: capterra.com)
Quick answer: the best Zabbix alternative for your situation
For most teams, the best Zabbix alternative is Checkmk Community. It covers the same ground as Zabbix (servers, network devices and services) and discovers far more on its own. If your setup is narrower, a more specialized tool will fit better:
- Homelab, or you only need to know “is it up?”: Uptime Kuma, Beszel or Netdata.
- Switches and routers over SNMP: LibreNMS.
- Closest like-for-like, but easier: Checkmk Community.
- Kubernetes and microservices: Prometheus + Grafana.
- You don’t want to run a monitoring server: Datadog, or Paessler PRTG if you want a Windows install with vendor support.
The ranked list
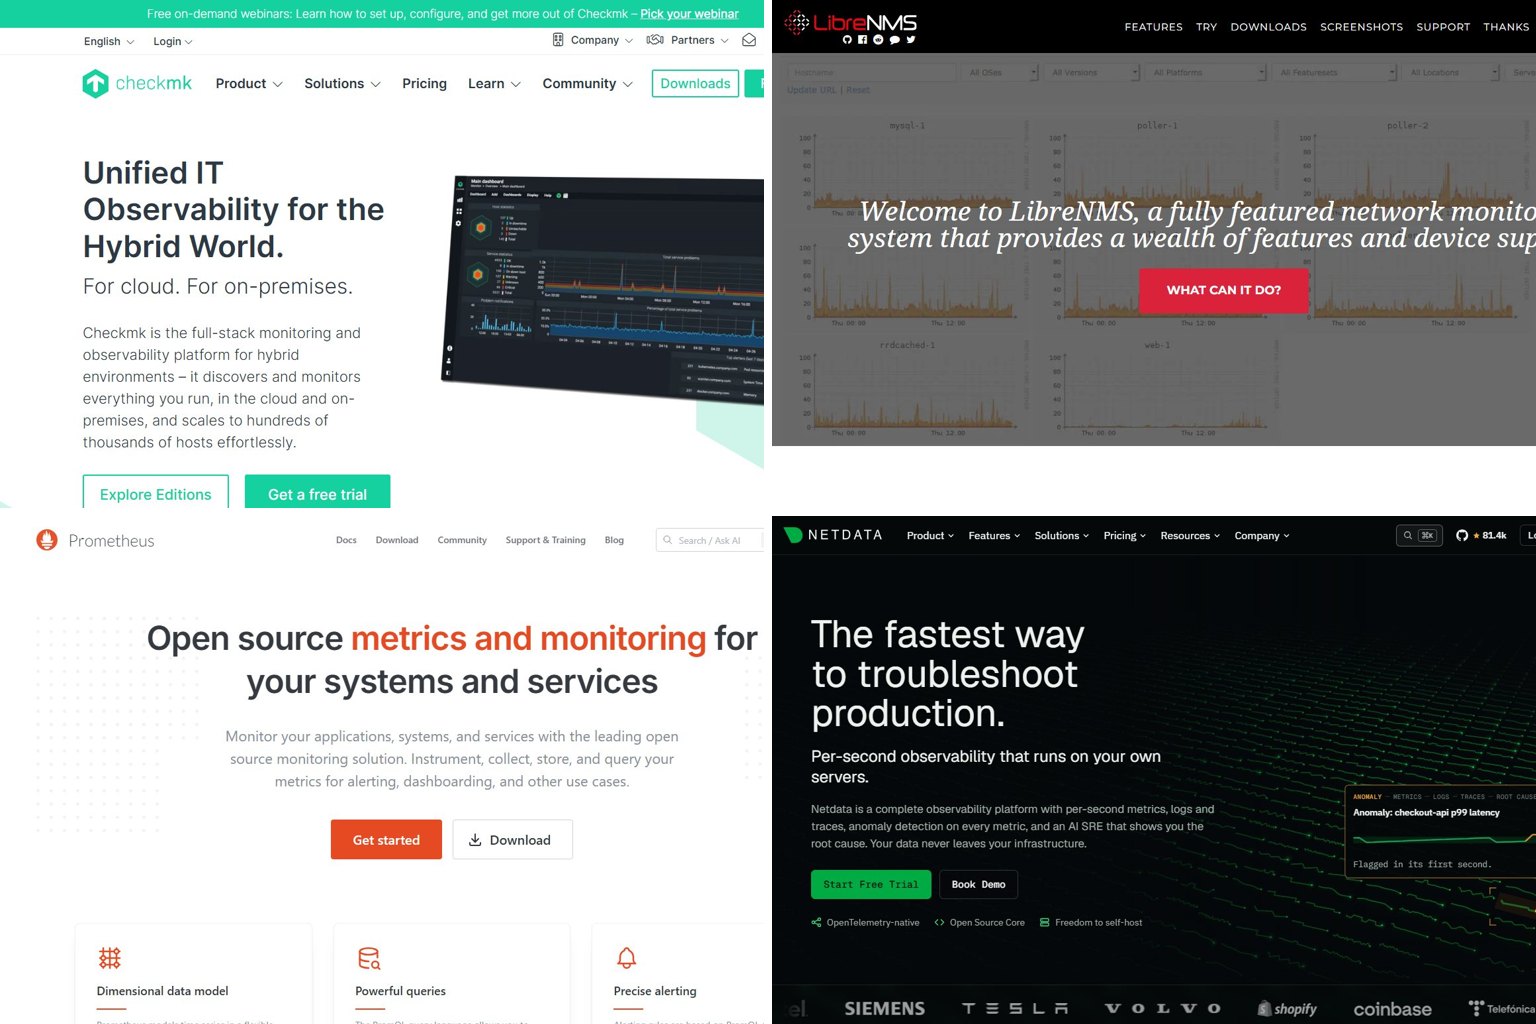
- Checkmk Community: top pick for most Zabbix users.
- LibreNMS: best free tool for network monitoring.
- Prometheus + Grafana: best for cloud-native and Kubernetes.
- Netdata: best for real-time, per-second troubleshooting.
- Icinga 2: best for automation and distributed sites.
- Datadog: best fully managed SaaS.
- Paessler PRTG: best commercial all-in-one for Windows shops.
- ManageEngine OpManager: best budget commercial network tool.
- Nagios Core: the veteran, with a huge plugin library.
- Uptime Kuma: best lightweight uptime checker for homelabs.
The tool sections below are grouped by type (free, lightweight, paid), not by rank, so each block starts with a “Rank” line. Four more tools are labeled Also worth a look and are unranked: Beszel, SolarWinds Observability, New Relic and Microsoft SCOM. Each one serves a narrower use case.
Enterprise options not ranked: Dynatrace and IBM SevOne show up on Gartner’s alternatives lists. They’re left out here because both are quote-only enterprise platforms built for large organizations, and they cost far more than a typical Zabbix replacement.
How this list was ranked
The ranking draws on published documentation, current pricing pages, Gartner Peer Insights ratings and community reports. The criteria are weighted in this order:
- Replacement coverage (highest weight): how much of what Zabbix does (hosts, network, services, alerting, history) the tool can take over.
- Effort to run: setup time, upkeep and the skill level needed.
- Honest cost: whether the free tier is actually usable and the paid pricing is clear.
- Project health: recent releases and an active vendor or community.
- Data ownership: whether you can self-host and keep your metrics.
A word on bias: three of the five pages ranking for this search are written by vendors, and each puts its own product at or near the top. This list has nothing to sell. Vendor pricing appears only where it could be checked.
Name your reason first
Write down why you’re leaving before you look at tools. “Too complex for 5 servers” and “no traces for our microservices” point to completely different tools.
Before you switch: does Zabbix 8.0 fix your problem?
It might. Zabbix 8.0 LTS directly addresses three of the most common complaints: no APM, a heavy SQL database and floods of alerts. It does little for the learning curve, and the interface looks the same as before. Spend an hour with 8.0 on a test server before you commit to a migration.
What’s new in Zabbix 8.0 LTS in plain English
Zabbix’s own announcement and coverage from AlternativeTo and Linuxiac describe these changes:
- OpenTelemetry built in. The Zabbix proxy can now receive OTLP/gRPC data from your applications or existing OpenTelemetry collectors. A new APM menu shows the traces, metrics and logs.
- ClickHouse history backend. You can store item history in ClickHouse instead of only MySQL or PostgreSQL. The release notes list ClickHouse 26.3 to 26.9 as supported.
- Complex event processing. Related events are grouped into a cause and its symptoms, so one failed core switch no longer sets off 40 separate alerts.
- An MCP server. AI agents can connect through the Model Context Protocol using a Zabbix API token.
- Security additions. These include HashiCorp Vault AppRole authentication and audit log export.
Did you know?
According to initMAX’s 8.0 overview, the built-in MCP server lets AI agents query your Zabbix data, but only with the permissions of the API token’s owner. A read-only token gives you a read-only agent.
Complaints 8.0 fixes vs complaints it doesn’t
| Your complaint | Fixed in 8.0? | What changed |
|---|---|---|
| No APM or traces for microservices | Largely | Native OTLP intake and an APM menu |
| Database grows and slows down | Partly | ClickHouse handles large history volumes |
| Too many raw alerts | Partly | Event correlation into cause and symptoms |
| Steep learning curve | No | Templates, items and triggers work the same way |
| Dated or cluttered UI | No | The interface is still familiar Zabbix |
| Overkill for a homelab | No | It’s still a full server, database and frontend |
Zabbix support timeline: 7.0 vs 8.0
The Zabbix life cycle and release policy gives 7.0 LTS full support until June 30, 2027. Version 8.0 LTS has full support until November 30, 2029 and limited support until November 30, 2031.
| Area | 7.0 LTS | 8.0 LTS |
|---|---|---|
| Full support ends | June 30, 2027 | November 30, 2029 |
| Limited support ends | Earlier than 8.0 | November 30, 2031 |
| OpenTelemetry / APM | Not native | Native OTLP via proxy, APM menu |
| History storage | SQL databases | SQL or ClickHouse |
| Event correlation | Manual dependencies and tags | Complex event processing |
| AI agent access | API only | Built-in MCP server |
| Old agents | Older agents accepted | Pre-1.6 agents dropped |
The 8.0 upgrade notes include two caveats. Agents older than 1.6 are no longer supported, and the legacy trapper protocols have been removed. If old appliances are still running ancient agents, audit them first.
Before you start
Back up the Zabbix database before any major upgrade. If you can wait, hold production until the first point release (8.0.1) and test on a copy first.
Why people leave Zabbix (in their own words)
Most people who leave don’t think Zabbix is bad. They think it’s the wrong size or shape for them. Threads on r/selfhosted and in other forums keep coming back to the same five pain points.
- Overkill for a homelab. A common line on r/selfhosted is that Zabbix “scales very well against hundreds of servers, but it’s overkill for a home lab.” Running a server, a database, a frontend and agents to watch six containers feels like too much.
- Database growth and upgrade breakage. History tables get large and need housekeeping and tuning. Some users report a database that was corrupted or got stuck during an upgrade.
- Templates and triggers. The built-in templates help, but custom checks mean learning items, preprocessing, macros and trigger expressions.
- Proxies at scale. Distributed sites need proxies, and each one is more infrastructure to patch.
- The UI. Some people find it dense, though that’s a matter of taste.
One complaint keeps coming up: writing a simple script was easier than learning, writing and testing YAML or template configuration. If that sounds like you, look for a middle ground. Checkmk’s auto-discovery and Uptime Kuma’s web forms are the closest fits.
Zabbix alternatives compared at a glance
The table shows each tool’s rank, where it runs, what you get for free and where paid plans start. Prices are as of November 19, 2026, and third-party figures are marked as such.
| Rank | Tool | Best for | Open source? | Self-hosted / SaaS | Free option | Paid starting point | Current version | Setup effort |
|---|---|---|---|---|---|---|---|---|
| 1 | Checkmk | Like-for-like replacement | Community edition | Both | Community, unlimited hosts | Pro / Ultimate (quote) | 2.5 | Medium |
| 2 | LibreNMS | SNMP network gear | Yes | Self-hosted | Fully free | None | 26.x (year.month) | Medium |
| 3 | Prometheus + Grafana | Kubernetes, apps | Yes | Both | Fully free | Grafana Cloud plans | Prometheus 3.16 (3.13 LTS) | High |
| 4 | Netdata | Real-time troubleshooting | Agent yes | Both | 5 nodes on Cloud | $4.50/node/month (billed yearly) | Frequent releases | Low |
| 5 | Icinga 2 | Automation, distributed | Yes | Self-hosted | Fully free | Vendor support | 2.16.6 | High |
| 6 | Datadog | No-maintenance SaaS | No | SaaS | None (contact-sales Basic tier) | $15/host/month (yearly, third-party) | Continuous | Low |
| 7 | Paessler PRTG | Windows all-in-one | No | Both | 100 sensors | PRTG 500: $200/month billed annually | Rolling updates | Low |
| 8 | ManageEngine OpManager | Budget network suite | No | Self-hosted | Small free edition | About $95/year, 10 devices (third-party) | Rolling updates | Low |
| 9 | Nagios Core | Plugin-heavy classic setups | Yes | Self-hosted | Fully free | Nagios XI | 4.5.x | High |
| 10 | Uptime Kuma | Homelab uptime | Yes | Self-hosted | Fully free | None | 2.5.x | Very low |
Why PRTG and Netdata prices differ on other lists: some lists quote one annual total for a larger PRTG sensor tier, or an older Netdata per-node rate. The figures here are the entry PRTG 500 subscription at its monthly rate billed annually, and Netdata Business at $4.50 per node billed yearly (about $6 billed monthly). Both were checked on November 19, 2026.
User ratings on Gartner Peer Insights
Among the tools Gartner lists, Datadog has the highest rating and OpManager has by far the most reviews. Zabbix sits at 4.5, level with most of the field. Gartner notes that Peer Insights reviews are individual users’ opinions. The counts also shift slightly between snapshots, so read these as indicative.
| Product | Gartner Peer Insights rating | Number of ratings (Nov 2026) |
|---|---|---|
| Datadog | 4.6 | About 355 |
| ManageEngine OpManager | 4.5 | About 1,022 |
| Paessler PRTG | 4.5 | About 829 |
| Checkmk | 4.5 | About 137 |
| Grafana Enterprise | 4.5 | About 338 |
| Zabbix (for comparison) | 4.5 | About 346 |
| Nagios XI | 4.3 | About 250 |
High ratings with low review counts (Checkmk’s 137) tell you less than the 1,000-plus reviews behind OpManager. Community tools such as LibreNMS, Uptime Kuma and Beszel have few enterprise reviews, so their GitHub activity, covered below, is the better health signal.
Free tiers: what you actually get
| Tool | Free limit | Commercial use allowed? | Catch |
|---|---|---|---|
| Zabbix | Unlimited | Yes | You pay in time, or for support |
| Checkmk Community | Unlimited hosts | Yes | OpenTelemetry and Checkmk Relay are Ultimate-only |
| Netdata Community | 5 active nodes, 1 custom dashboard | Yes | Homelab plan ($90/year) is personal use only |
| Datadog Basic | No self-serve free plan | Yes | The free 5-host plan was replaced by a contact-sales tier for noncritical workloads |
| PRTG Freeware | 100 sensors | Yes | Roughly 10 devices, because each check is a sensor |
| New Relic Free | 100 GB ingest/month | Yes | One full platform user, overage billed per GB |
| LibreNMS, Icinga 2, Nagios Core, Prometheus, Uptime Kuma, Beszel | Unlimited | Yes | You host and maintain it |
Did you know?
According to SpotSaaS’s PRTG pricing breakdown, PRTG counts sensors, not devices. Each CPU, disk, port or service check uses one sensor, so the free 100 sensors cover only about 10 devices.
Best free and open-source Zabbix alternatives
These tools cost nothing in licenses. In return, you run the server, apply the updates and own the data, just as you do with Zabbix. Each block says what you give up compared with Zabbix, so the trade-off is clear.
Project health on GitHub
All the open-source picks are actively maintained, but they differ a lot in community size and license. Star counts are approximate GitHub figures from November 2026 snapshots. They show how popular a project is, not how widely it runs in production. Checkmk, for example, is deployed far more widely in mid-sized European companies than its star count suggests.
| Project | GitHub repo | License | Approx. stars (Nov 2026) | Latest release seen |
|---|---|---|---|---|
| Uptime Kuma | louislam/uptime-kuma | MIT | About 94,600 | 2.5.x, fall 2026 |
| Netdata | netdata/netdata | GPLv3+ | About 81,400 | Frequent releases |
| Prometheus | prometheus/prometheus | Apache 2.0 | About 67,600 | 3.16.0, November 5, 2026 |
| Beszel | henrygd/beszel | MIT | About 25,000 | 0.21.0, October 2, 2026 |
| LibreNMS | librenms/librenms | GPLv3 | About 5,000 | 26.9.x, 2026 |
| Checkmk | Checkmk/checkmk | GPLv2 (Community) | About 2,600 | 2.5, stable since April 28, 2026 |
| Icinga 2 | Icinga/icinga2 | GPLv2 | About 2,200 | 2.16.6, October 28, 2026 |
Check the bus factor
Beszel is run by one developer, henrygd. That’s fine for a homelab, but for a business you’re better off with a project backed by a company or a large contributor base, such as Checkmk, Prometheus or LibreNMS.
Checkmk Community (formerly Raw): closest replacement
Rank: #1 of 10.
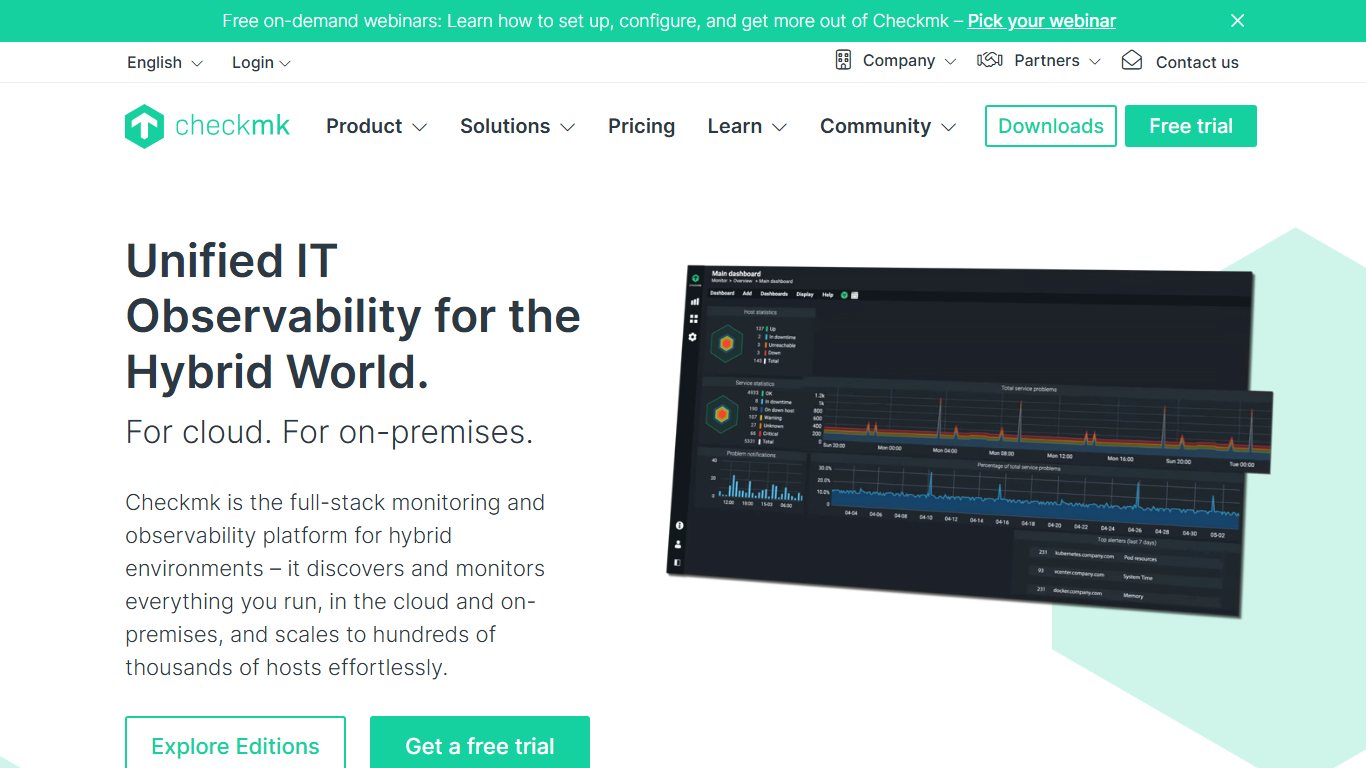
Checkmk Community is the free, open-source edition of Checkmk, and it’s the strongest like-for-like swap for Zabbix. It monitors servers, network devices, applications and cloud services. Service discovery scans each host and offers hundreds of ready-made checks, so you don’t have to build templates by hand.
Best for: IT teams that want what Zabbix does with less configuration work.
What changed in 2026: Checkmk 2.5, stable since April 28, 2026, renamed its editions. Raw became Community, Enterprise became Pro, Cloud became Ultimate, and Managed Services became Ultimate with Multi-Tenancy. Older guides still use the old names. Native OpenTelemetry support and Checkmk Relay come only with Ultimate.
Licensing catch: From 2.5.0, Pro uses the same license verification as Ultimate. You can update a Pro site to 2.5 only if it was already licensed on 2.4.0, so check before you plan a major update.
What you give up: Community runs on the Nagios core instead of the faster Checkmk Micro Core in the paid editions, and very large setups will notice the difference. Your Zabbix templates also won’t import.
Setup effort: Medium. Packages exist for the major Linux distributions, and rolling out the agent is straightforward.
LibreNMS: best for network gear and SNMP
Rank: #2 of 10.
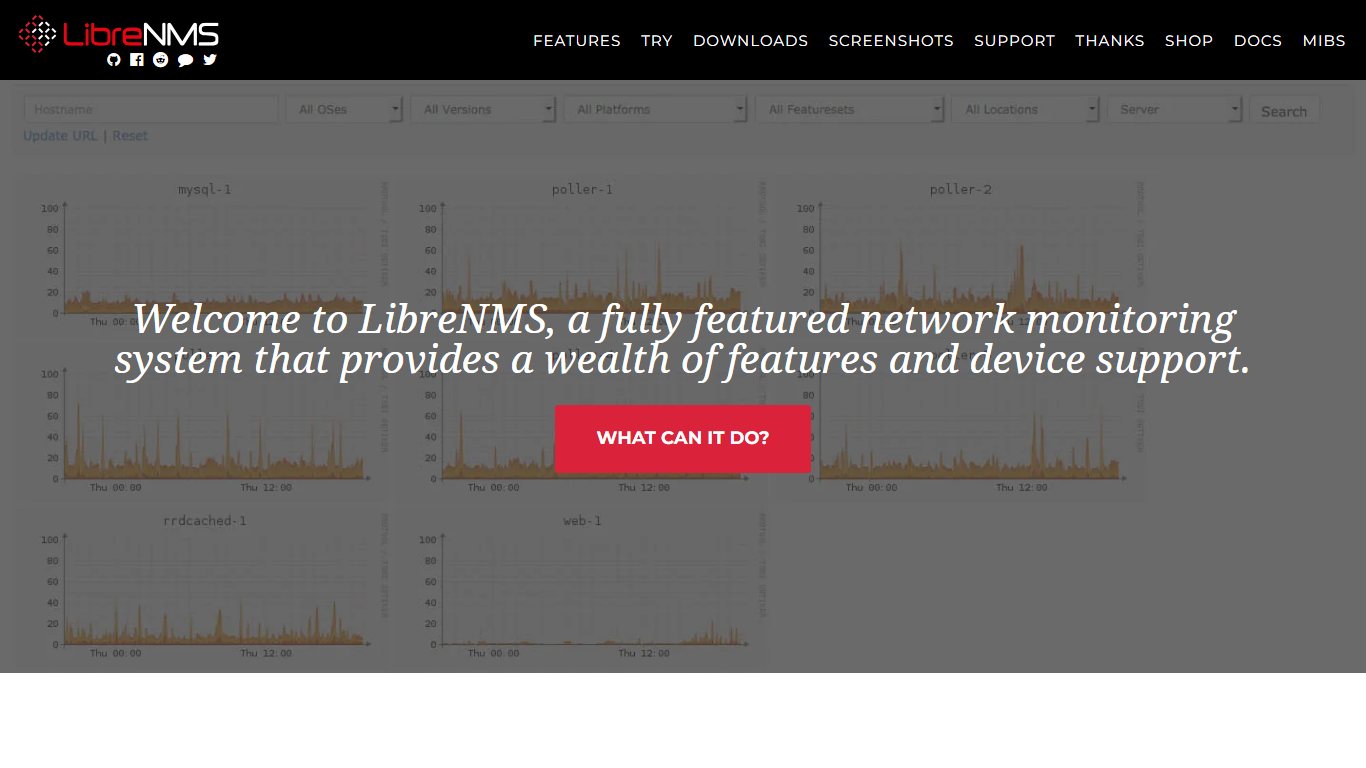
LibreNMS is a free, community-run network monitoring system with very good SNMP auto-discovery. Point it at a subnet and it finds switches, routers, firewalls and access points. It maps neighbors through CDP and LLDP and graphs ports straight away.
Best for: Network engineers and MSPs whose estate is mostly switches, routers and Wi-Fi.
Version: LibreNMS uses year.month version numbers. A 2026 Linux monitoring roundup by ComputingForGeeks tested 26.9.1.1. The project is GPLv3-licensed and has about 5,000 GitHub stars.
What you give up: Application and deep server monitoring are weaker than in Zabbix. Long-term metrics are stored as RRD files, which keeps storage small but makes ad-hoc queries harder.
Setup effort: Medium. Expect a LAMP-style stack, or use the official Docker images.
SNMP-first networks
If you mostly monitor switches and routers, start with LibreNMS. Its SNMP auto-discovery saves you from building device templates by hand.
Prometheus + Grafana: best for Kubernetes and cloud-native
Rank: #3 of 10.
Prometheus is a CNCF-graduated metrics database that pulls data from exporters. Alertmanager handles notifications, and Grafana draws the dashboards. Together they’re the default monitoring stack for Kubernetes. The newest release is Prometheus 3.16.0 (November 5, 2026), and 3.13 is the current long-term support line, supported until July 31, 2027.
Best for: Platform teams running containers, microservices and anything that already exposes metrics.
What you give up: Prometheus has no host inventory, no built-in network discovery and no long-term storage without extra tools. You also have to learn PromQL and YAML. If Prometheus, Alertmanager and Grafana feel like too much for your homelab, go to Netdata or Beszel instead.
Related options: SigNoz is an open-source, OpenTelemetry-native platform built on ClickHouse. It suits teams that want traces and logs alongside metrics. Note that SigNoz also publishes one of the ranking comparison pages, and that page puts its own product first.
Setup effort: High, unless you use a Helm chart such as kube-prometheus-stack, which takes care of most of it.
Netdata: best for real-time, per-second troubleshooting
Rank: #4 of 10.
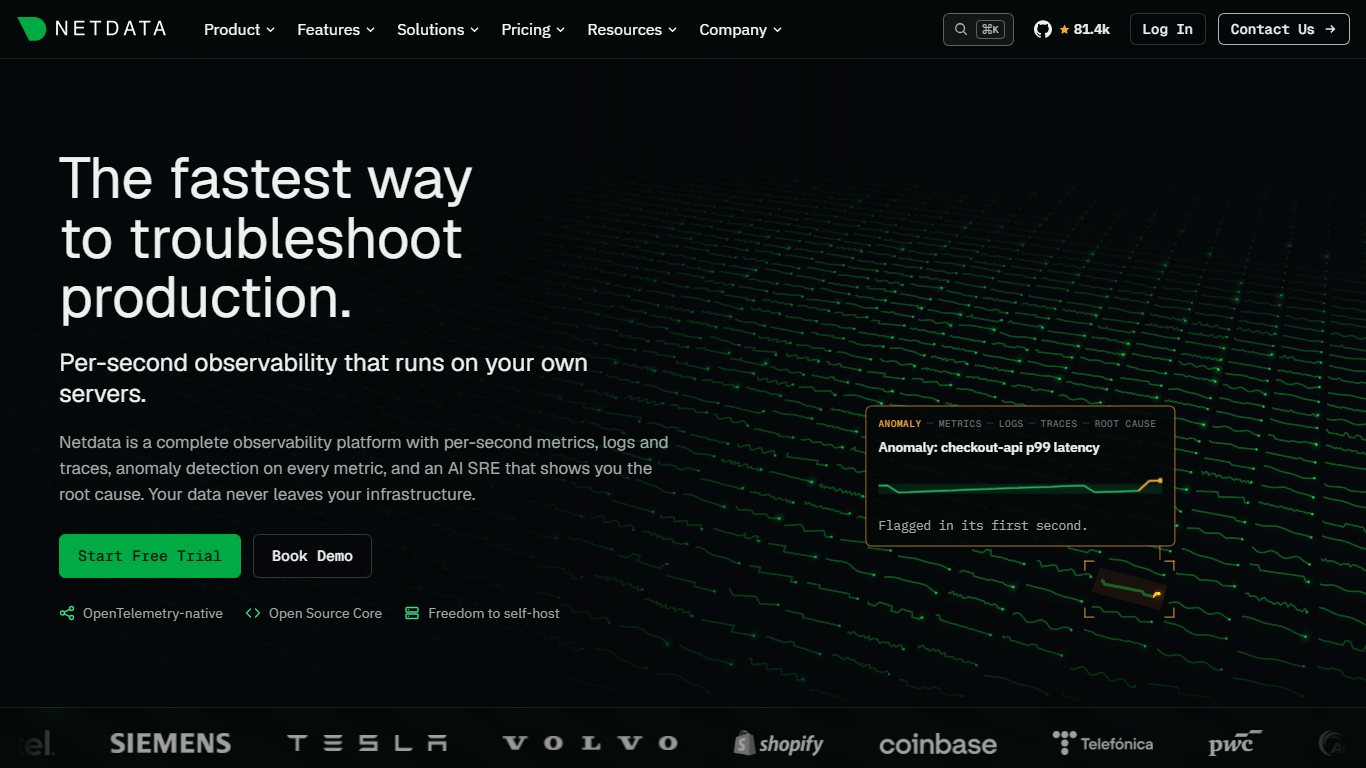
Netdata collects metrics every second and discovers most services on its own. It also runs anomaly detection on the data it collects. Install an agent and you get useful dashboards within minutes.
Best for: Troubleshooting performance spikes, and homelab users who want detail without writing config.
Pricing (as of November 19, 2026): The open-source Netdata Agent (GPLv3+) is free on any number of nodes. Netdata Cloud Community is free for up to 5 active connected nodes and 1 custom dashboard. The Homelab plan costs $90 a year for unlimited nodes, but you self-certify that it’s for personal, non-commercial use. Business costs $4.50 per node per month billed yearly, or about $6 billed monthly.
What you give up: Compared with Zabbix, Netdata is weaker at SNMP-heavy network monitoring and classic inventory-driven alerting.
Setup effort: Low.
Icinga 2: best for automation and distributed setups
Rank: #5 of 10.
Icinga started as a Nagios fork, and Icinga 2 is now its own engine. It has a REST API, distributed zones and the Icinga Director, which builds configuration from your CMDB or Ansible inventory. The current stable release is 2.16.6, dated October 28, 2026.
Best for: Teams that manage infrastructure as code across many sites.
What you give up: It needs more planning than any other tool here. Setup involves several moving parts (Icinga DB, Icinga Web, Director), and you get less out-of-the-box discovery than with Checkmk.
Setup effort: High.
Nagios Core: the veteran
Rank: #9 of 10.
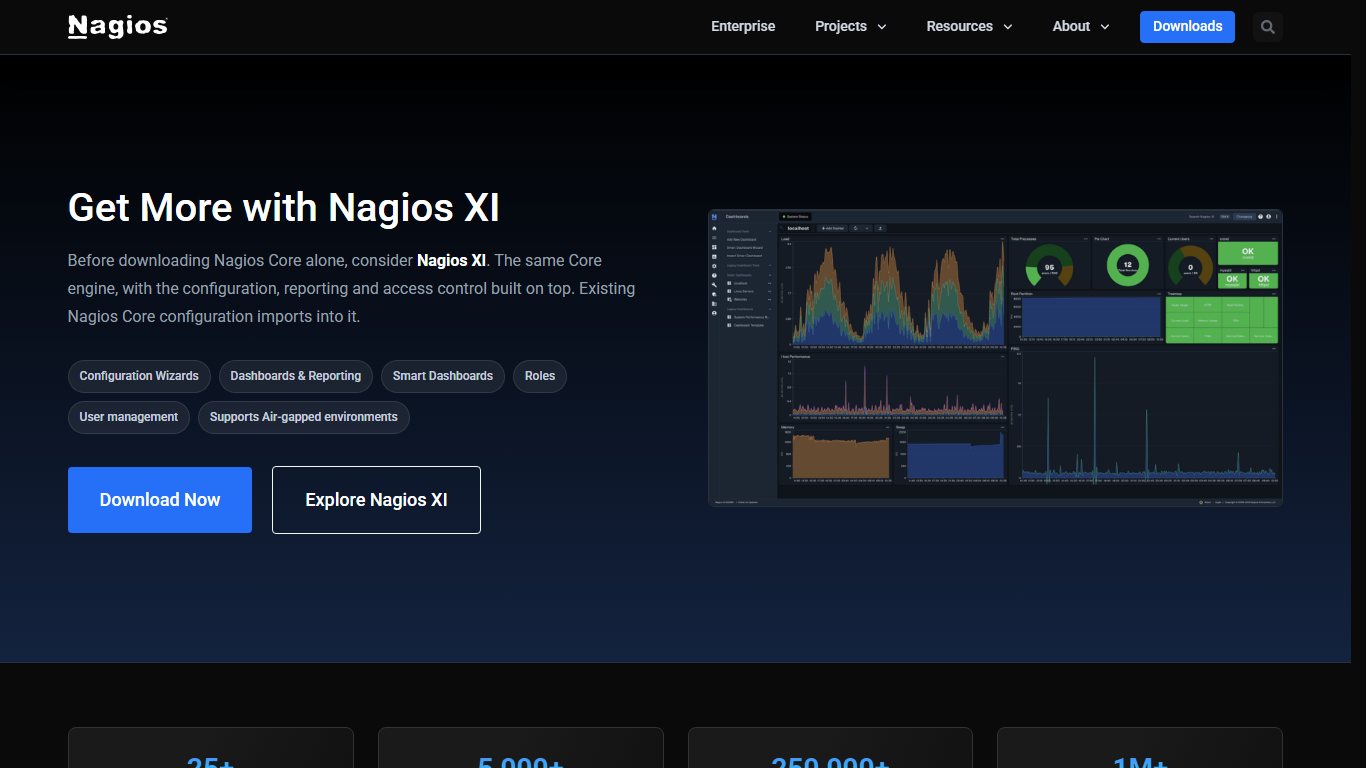
Nagios Core is the original open-source monitoring engine. Thousands of plugins exist for it, and both Icinga and the core behind Checkmk Community grew out of its model. It’s still maintained on the 4.5 branch. Nagios XI is the commercial version, with web-based setup, and it rates 4.3 on Gartner Peer Insights from about 250 ratings.
Best for: Teams with existing Nagios plugins and the patience to edit config files.
What you give up: Modern dashboards, built-in graphing and auto-discovery. Nearly everything is done in text files.
Setup effort: High.
Lightweight picks for homelabs and small offices
If you want a less complex Zabbix alternative to self-host, start here. These tools are far easier to run than Zabbix but do much less. Use them for uptime and basic resource graphs, not for SNMP depth or years of history.
Uptime Kuma
Rank: #10 of 10.
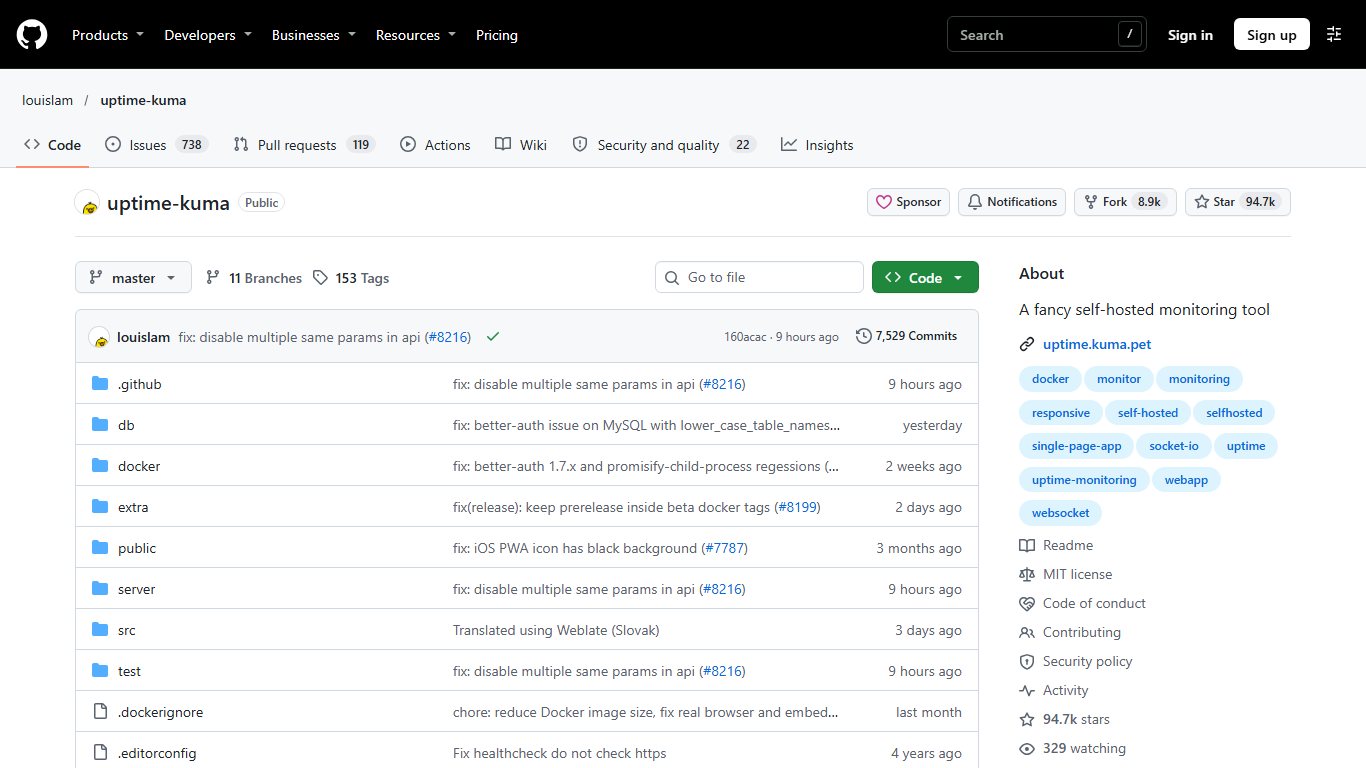
Uptime Kuma is a self-hosted uptime monitor from developer Louis Lam. It checks HTTP, TCP, ping, DNS and Docker containers, and it can send alerts to dozens of notification services. It also builds public status pages. Version 2.0 added MariaDB support and rootless Docker, and 2.5.x releases continued through fall 2026. With about 94,600 GitHub stars, it’s the most-starred project in this guide.
Is Uptime Kuma enough? Yes, if your question is “is it up, and how fast does it respond?” No, if you need CPU, disk and interface statistics for each host. In that case, pair it with Beszel or Netdata, or step up to Checkmk Community.
Beszel (also worth a look)
Unranked: a narrower tool for small server fleets.
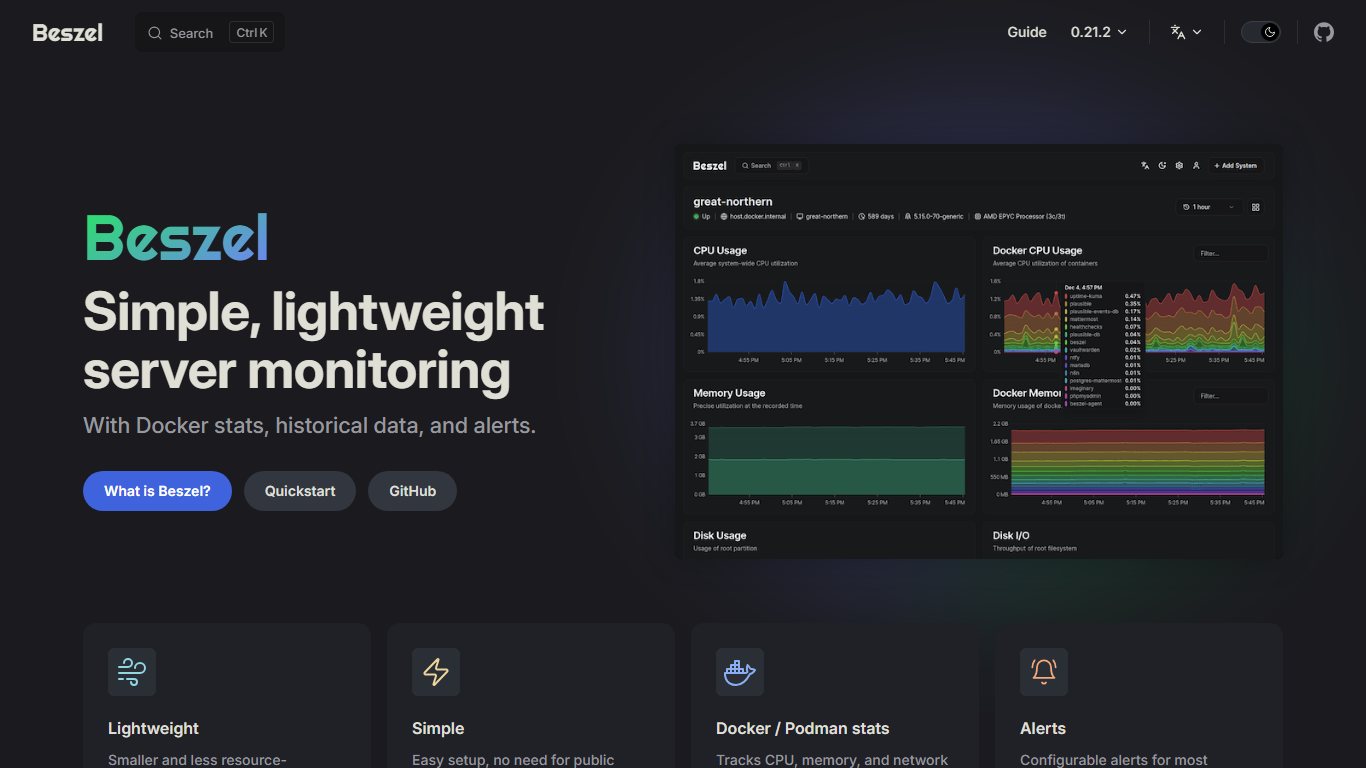
Beszel is a small, MIT-licensed server monitor with two parts: a hub that serves the dashboard and a tiny agent on each machine. It shows CPU, memory, disk, network and per-container Docker stats, with simple threshold alerts. It’s still pre-1.0: version 0.21.0 arrived on October 2, 2026, and the repo has about 25,000 stars. It works well for a few Proxmox hosts and VPSs, but it has no SNMP and no service-level checks.
Best paid and SaaS Zabbix alternatives
Paid tools trade your maintenance time for a monthly bill. The billing unit matters more than the headline price, because hosts, sensors, devices and gigabytes all add up differently.
Datadog
Rank: #6 of 10.
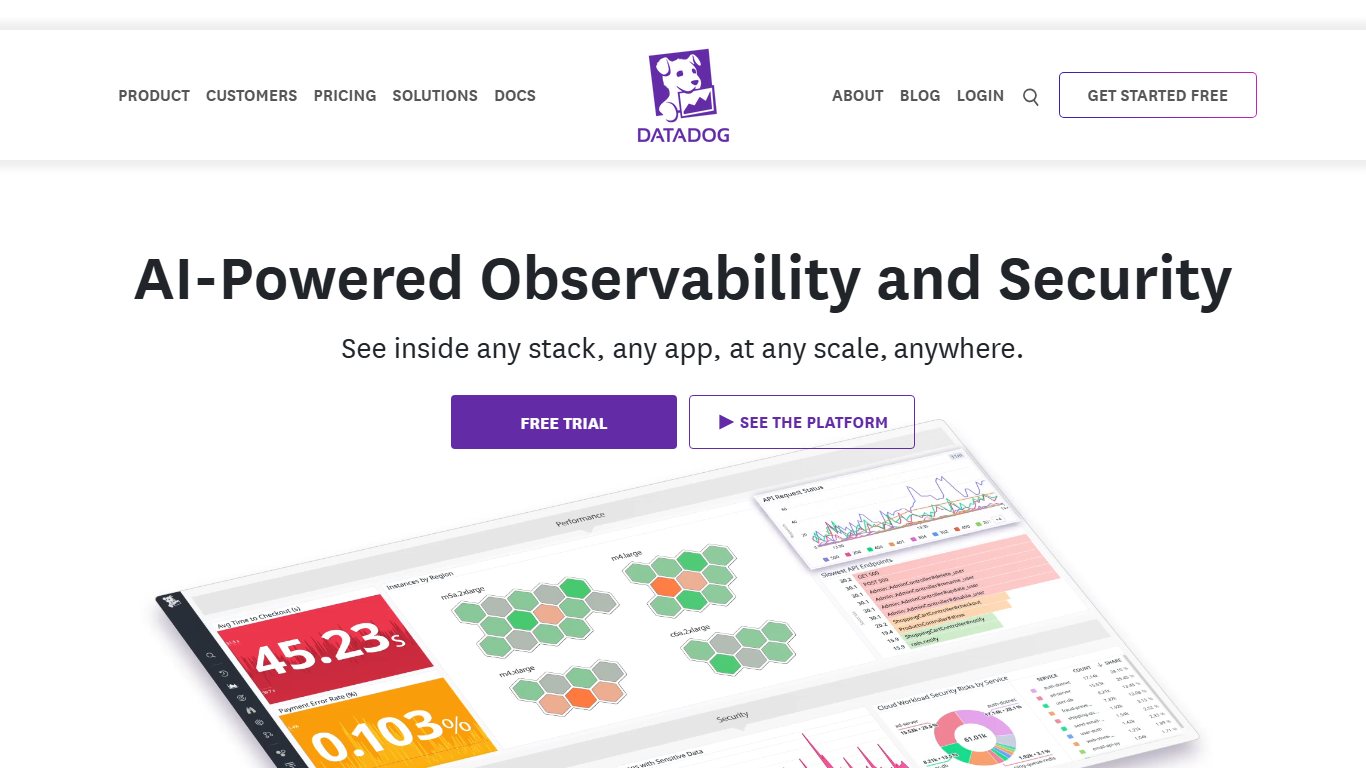
Datadog is a fully managed observability platform for infrastructure, APM, logs and more. Third-party pricing reports for 2026 put Infrastructure Pro at $15 per host per month billed annually ($18 on-demand). Enterprise is $23 per host billed annually ($27 on-demand), and APM adds about $31 per host. The old free plan for up to 5 hosts has been replaced by a contact-sales Basic tier for noncritical workloads. Datadog has the highest Gartner Peer Insights rating in this guide, at 4.6 from about 355 ratings.
Watch for: Every product is billed separately, and custom metrics and log volume grow quickly. Agree on a usage cap with your account team.
Paessler PRTG
Rank: #7 of 10.
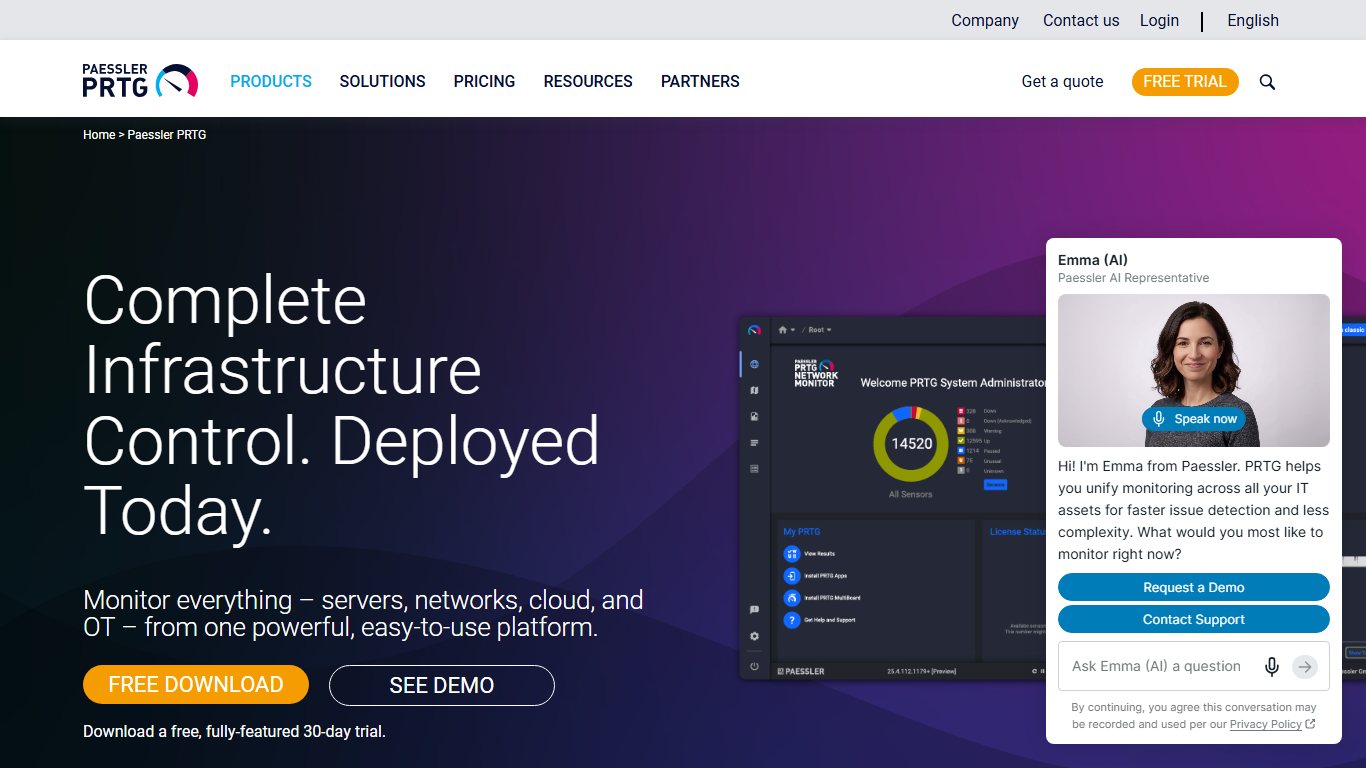
PRTG is a Windows-based all-in-one monitor with auto-discovery, a big sensor library and a hosted option. It has been subscription-only since 2024. The freeware edition gives you 100 sensors. PRTG 500 costs $200 a month billed annually (about $2,400 a year) and covers roughly 50 devices.
| PRTG tier | Sensors | Monthly price, billed annually |
|---|---|---|
| Freeware | 100 | $0 |
| PRTG 500 | 500 | $200 |
| PRTG 1000 | 1,000 | $358 |
| PRTG 2500 | 2,500 | $742 |
| PRTG 5000 | 5,000 | $1,300 |
| PRTG 10000 | 10,000 | $1,642 |
PRTG Hosted 500 is listed at about $2,399 a year. Reseller quotes and multi-year terms vary, so get a final price from Paessler or your reseller.
ManageEngine OpManager
Rank: #8 of 10.
OpManager is a network and server monitoring suite with a gentler learning curve than Zabbix. Capterra and Software Advice list Standard from about $95 a year for 10 devices and Professional at about $145. Enterprise is listed at about $4,595 a year for 250 devices. There’s also a small free edition. OpManager has the most Gartner Peer Insights reviews of any tool here (4.5 from about 1,022 ratings). Confirm current tiers on ManageEngine’s site.
SolarWinds Observability (also worth a look)
Unranked: a per-device SaaS option for network-heavy teams.
SolarWinds Observability SaaS lists Network and Infrastructure Observability from $12 per active network device or host per month, billed annually. Application Observability starts at $27.50 per service. A host counts as “active” if it sent telemetry in the previous 24 hours.
New Relic (also worth a look)
Unranked: usage-based pricing that suits app-heavy teams.
New Relic bills by data volume, not by host. Every account gets 100 GB of free ingest per month, one full platform user and unlimited basic users. Beyond the free 100 GB, the original data option costs $0.40 per GB. For most teams, paid full-platform user seats end up as the bigger line item.
Microsoft SCOM (also worth a look)
Unranked: for Windows Server and System Center estates only.
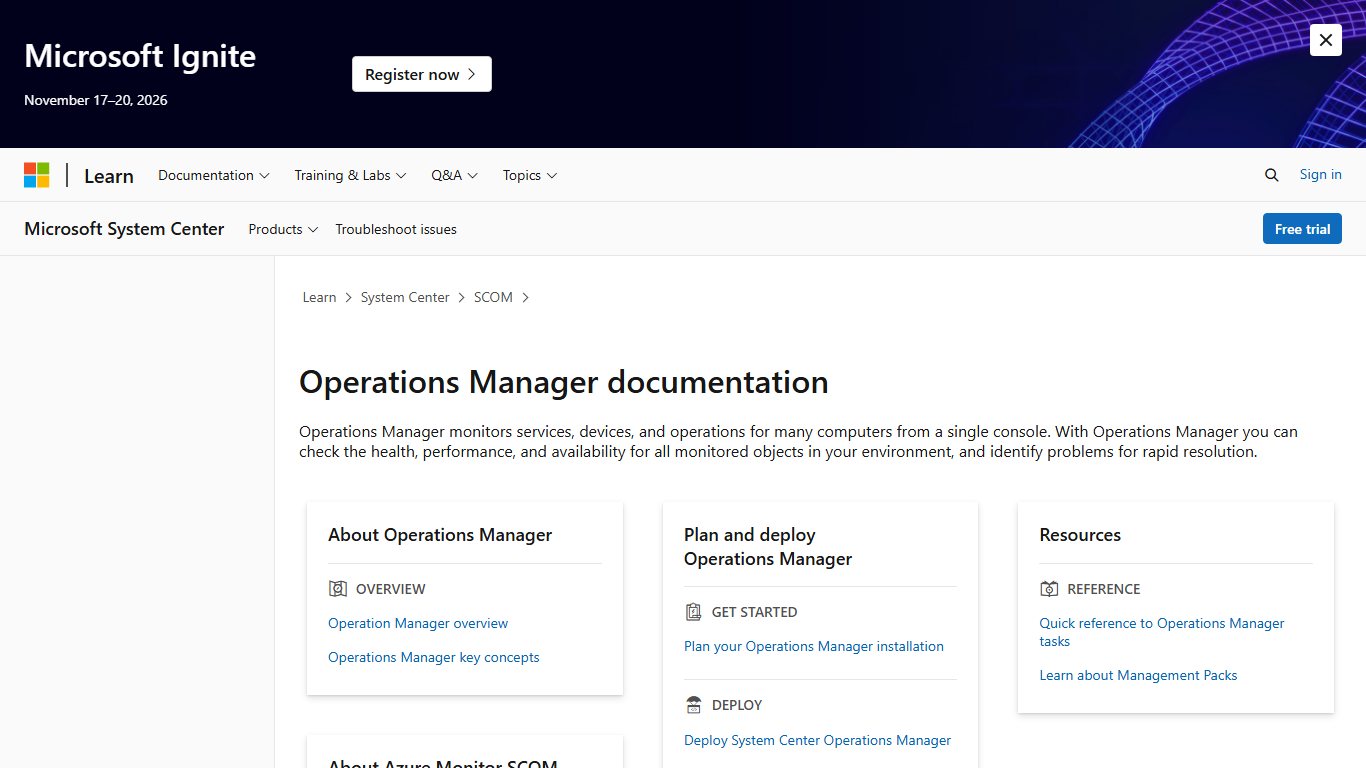
System Center Operations Manager makes sense only if you’re already deeply invested in Windows Server and System Center licensing. Its management packs for Microsoft workloads are excellent, but Linux and network coverage are not its strength.
Head-to-head: Zabbix vs Nagios, Checkmk and Grafana
These are the three comparisons people search for most. Nagios and Checkmk are real alternatives to Zabbix. Grafana is not.
| Factor | Zabbix 8.0 | Nagios Core | Checkmk Community | Grafana |
|---|---|---|---|---|
| Collects data itself | Yes | Yes, via plugins | Yes | No |
| Auto-discovery | Templates and rules | No | Strong, automatic | No |
| Built-in graphs and UI | Yes | Basic | Yes | Dashboards only |
| OpenTelemetry | Free, native | No | Ultimate only | Via data sources |
| Gartner rating | 4.5 (about 346) | Nagios XI 4.3 (about 250) | 4.5 (about 137) | Enterprise 4.5 (about 338) |
Zabbix vs Nagios
Zabbix is the better choice for most new setups. It includes a database, graphs, templates, discovery and a web UI. Nagios Core gives you a check engine and plugins, and you add everything else yourself. Nagios wins only if you already rely on a large set of custom Nagios plugins.
Zabbix vs Checkmk
Checkmk gets you productive faster. Its discovery creates sensible checks automatically, while Zabbix needs you to link templates and tune triggers. Zabbix is more flexible for custom data collection. And since 8.0, Zabbix includes OpenTelemetry for free, while Checkmk keeps it in the paid Ultimate edition.
Zabbix vs Grafana
They do different jobs. Grafana is a dashboard and visualization layer. It doesn’t collect data or monitor hosts on its own, so it can’t directly replace Zabbix. The Zabbix plugin for Grafana lets you build Grafana dashboards on top of your Zabbix data. Many teams keep Zabbix for collection and alerting and use Grafana for dashboards.
Pick by reason for leaving
Match your main complaint to a tool, and check what you lose by switching.
| Your complaint | Best alternative | Why | What you give up |
|---|---|---|---|
| Overkill for a homelab | Uptime Kuma + Beszel | Minutes to set up, tiny footprint | Network depth, long history |
| Templates and triggers are too much work | Checkmk Community | Auto-discovery creates checks | Zabbix’s custom-item flexibility |
| Mostly switches and routers | LibreNMS | SNMP discovery and port graphs | App-level monitoring |
| Kubernetes and microservices | Prometheus + Grafana | Native to the cloud-native ecosystem | Inventory, SNMP, easy setup |
| Database keeps breaking | Netdata or a SaaS tool | Little or no database for you to run | Data ownership, or money |
| No one wants to maintain a server | Datadog or PRTG Hosted | The vendor runs it | Predictable costs |
| Need traces and APM | Zabbix 8.0 first, then Datadog | 8.0 added OTLP and APM | Nothing, if the upgrade works |
Test the upgrade first
If your main complaint is missing APM or traces, try Zabbix 8.0’s OpenTelemetry support on a test server before migrating. Upgrading may beat moving.
What it really costs: a 20-host example
Self-hosted tools are the cheapest option at 20 hosts, even once you count your time. Netdata Business is the cheapest paid option, and Datadog with APM is by far the most expensive. This worked example covers 20 Linux servers at the prices above. For PRTG, it assumes about 10 sensors per host (CPU, memory, disks, ping and a few services). That makes 200 sensors, twice the freeware limit.
| Option | Calculation | Approx. yearly cost |
|---|---|---|
| Datadog Infrastructure Pro (annual) | 20 × $15 × 12 | $3,600 |
| Datadog Pro (on-demand) | 20 × $18 × 12 | $4,320 |
| Datadog Pro + APM (annual) | 20 × ($15 + $31) × 12 | $11,040 |
| SolarWinds Observability | 20 × $12 × 12 | $2,880 |
| Netdata Business (yearly) | 20 × $4.50 × 12 | $1,080 |
| Netdata Business (monthly) | 20 × $6 × 12 | $1,440 |
| PRTG 500 (billed annually) | $200 × 12 | $2,400 |
| Zabbix, Checkmk Community or LibreNMS | License-free | $0 plus a small VM and your time |
The self-hosted row isn’t truly free. For example, two hours of upkeep a month at $50 an hour comes to $1,200 a year. That’s still cheaper than most SaaS options at 20 hosts, though the gap narrows if upgrades go wrong.
The picture changes with scale. SaaS makes sense at 5 to 30 hosts, when nobody wants to own a server. At a few hundred hosts, per-host billing usually costs more than one person’s part-time upkeep. That’s where Zabbix, Checkmk and LibreNMS come out ahead.
How to move off Zabbix without losing alerts
Plan for a parallel run, not a weekend cutover. Leaving Zabbix means giving up three things: your templates, your long-term history and the proxy layout you built. Plan for each one.
Fix it
- Export your host list, host groups, linked templates and active triggers from Zabbix (Data collection > Hosts, then Export).
- Mark the 10 alerts that have woken someone up in the past year. They are your must-haves.
- Export the history and trends you need to keep, or keep the Zabbix database read-only for audits.
- Install the new tool and add a pilot group of 10 to 20 hosts.
- Rebuild your top 10 alerts first, then everything else.
- Run both tools side by side for 2 to 4 weeks and compare every alert.
- Move notification channels (email, Slack, PagerDuty, SMS) to the new tool.
- Replace remote Zabbix proxies with the new tool’s equivalent, such as Checkmk distributed sites or Prometheus agents.
- Disable Zabbix alerting, keep it read-only for a month, then retire it.
Run them side by side
Don’t turn Zabbix off until the new tool has caught every real incident during the parallel run. Missed alerts tend to show up in week three, not on day one.
If you work in a regulated environment or monitor several hundred hosts across sites, get vendor help. Zabbix, Checkmk, Paessler and Datadog all offer professional services that can plan the move.
FAQ
What is the best free alternative to Zabbix?
Checkmk Community is the best all-round free alternative. LibreNMS is best for network devices, and Uptime Kuma is best for simple homelab uptime checks.
Is there a free version of Zabbix?
Yes. Zabbix is open source and free for any number of hosts. You pay only for official support, training or Zabbix’s hosted Zabbix Cloud.
Which is better, Nagios or Zabbix?
Zabbix, for nearly all new setups. It includes graphs, discovery and a web UI, while Nagios Core needs add-ons for most of that. On Gartner Peer Insights, Zabbix rates 4.5 and Nagios XI rates 4.3.
Is Zabbix better than Grafana?
They aren’t competitors. Grafana visualizes data, while Zabbix collects data and sends alerts. You can run Grafana on top of Zabbix with the Zabbix plugin.
Zabbix vs Checkmk: which is easier?
Checkmk. Its auto-discovery sets up most checks for you, while Zabbix needs template and trigger work.
Which Zabbix alternatives are on GitHub?
Uptime Kuma (about 94,600 stars, MIT), Netdata (about 81,400, GPLv3+), Prometheus (about 67,600, Apache 2.0), Beszel (about 25,000, MIT), LibreNMS (about 5,000, GPLv3), Checkmk (about 2,600, GPLv2) and Icinga 2 (about 2,200, GPLv2) all develop in public on GitHub. Stars measure popularity, not production use, so also check how recent the last release is.
What does Reddit recommend instead of Zabbix?
On r/selfhosted, the usual suggestions are Uptime Kuma for uptime, Beszel or Netdata for resource graphs, and Checkmk or LibreNMS when someone needs real infrastructure monitoring. The most common reason given for leaving is that Zabbix is overkill for a home lab.
What are the top 3 network monitoring tools?
For free self-hosted network monitoring, choose LibreNMS, Checkmk Community or Zabbix. Among commercial tools, PRTG, ManageEngine OpManager and SolarWinds are the usual shortlist.
Is Checkmk free?
Checkmk Community is free and open source with no host limit. Pro, Ultimate and Ultimate with Multi-Tenancy are paid editions.
Is LibreNMS better than Zabbix for network monitoring?
For SNMP switches and routers, usually yes. Discovery, neighbor mapping and port graphs work with almost no setup. Zabbix is better when you also need deep server and application checks.
Can Prometheus replace Zabbix?
For Kubernetes and apps, yes. For a mixed estate of servers, printers, UPSs and network gear, it takes a lot of exporters and extra work, and Checkmk or Zabbix is simpler.
How much does PRTG cost in 2026?
The freeware edition is free for 100 sensors. PRTG 500 costs $200 a month billed annually, and the tiers run up to PRTG 10000 at $1,642 a month. Because every check uses a sensor, plan for roughly 10 sensors per device.
What’s new in Zabbix 8.0 and should I upgrade from 7.0?
Zabbix 8.0 adds OpenTelemetry/APM, ClickHouse history, event correlation and an MCP server. Upgrade before 7.0 LTS full support ends on June 30, 2027, ideally after the first point release.
Should I wait for 8.0.1 before upgrading Zabbix?
For production, yes, if you can. Test 8.0.0 on a copy of your database now, check for agents older than 1.6, and upgrade once the first fixes land.
My Zabbix database got corrupted during an upgrade. What’s easier to maintain?
Netdata or a SaaS tool removes most database upkeep. If you want to stay self-hosted, Checkmk Community keeps its data in RRD files and doesn’t need a large SQL database.
Whichever tool you pick, start with the one problem you most want to fix. Then trial the matching tool on 10 hosts this month, well before the 7.0 deadline.